Describing visual data – C1 English Writing
Describing visual data
Graphs and charts present large amounts of information in a clear, visual way. At C1 level, one common writing task is describing visual data, identifying key trends or facts and drawing clear conclusions. In this lesson, we will show you how to write an effective description by selecting the most relevant details, comparing figures and explaining trends and changes accurately and concisely.
Types of visual data
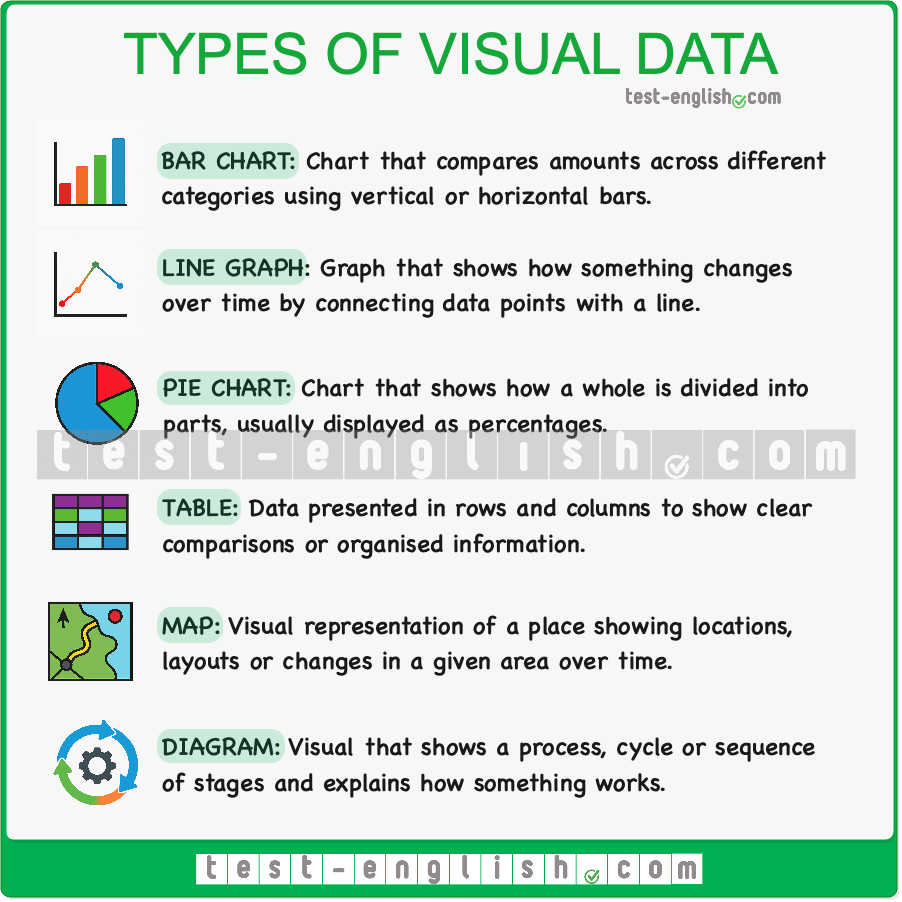
In writing tasks, you may need to describe different kinds of visual data. The chart below shows six common types and what each one is used for.
Planning your text
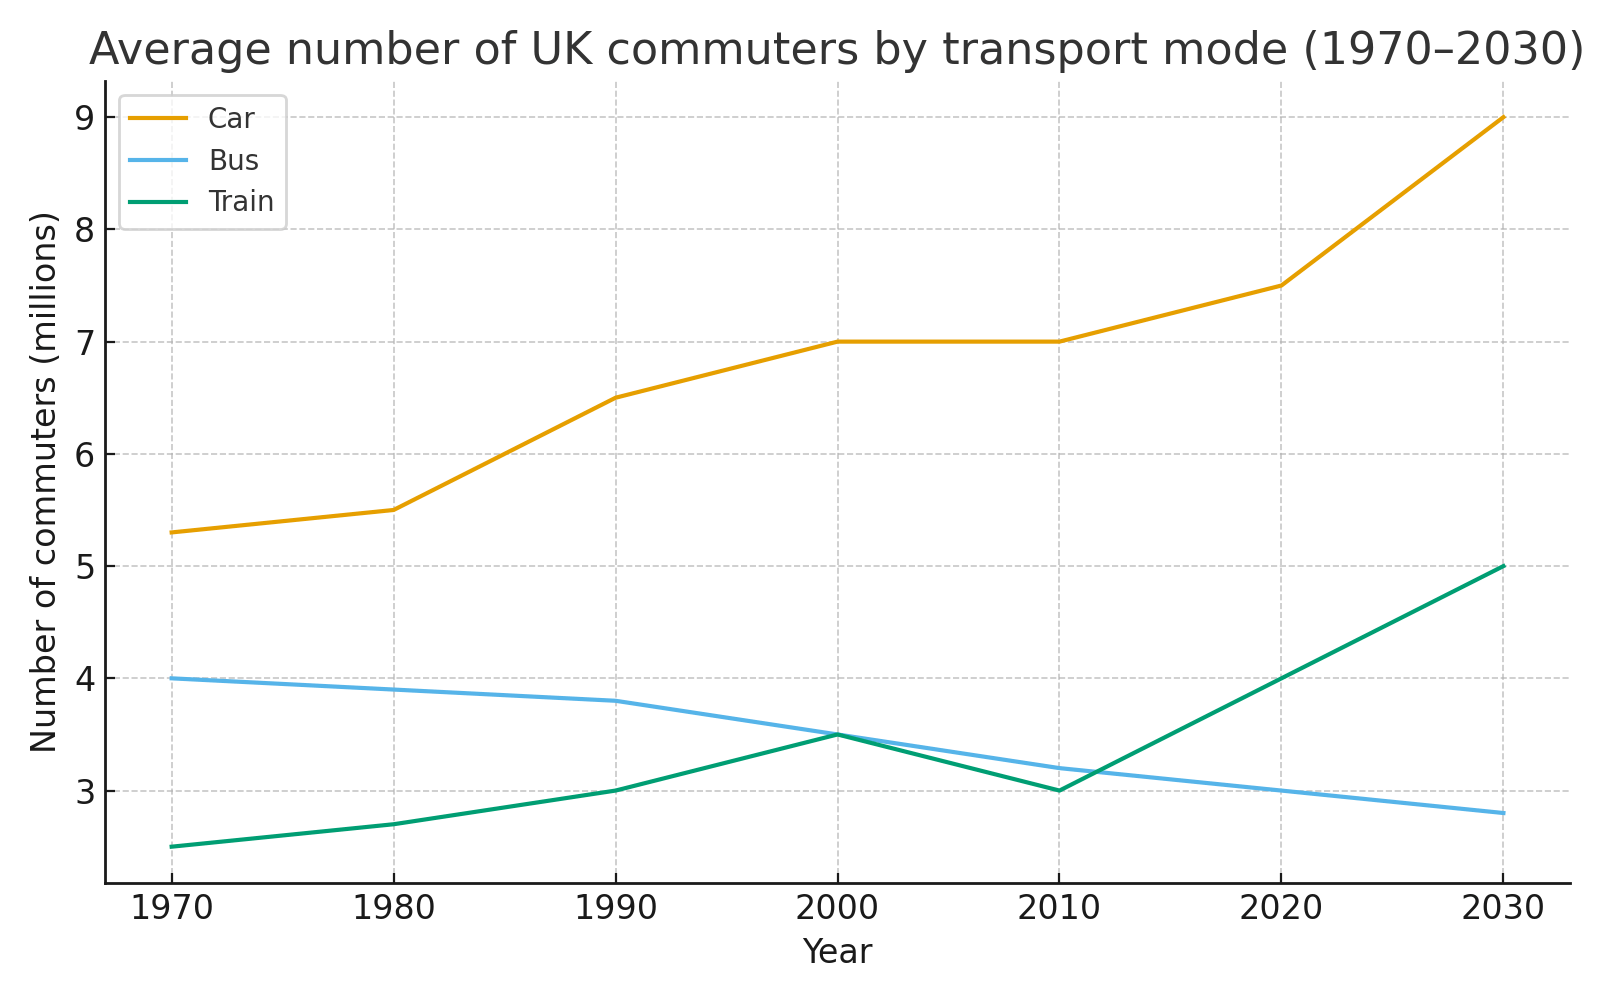
Here is the line graph that we will use as an example.
When describing visual information, planning helps you decide what to include and how to organise it. Before you start writing, spend a moment identifying the main features and grouping the information logically.
1️⃣ Analyse the visual
Check the basics quickly: the type of chart, the topic, the categories, the time period and the units. This gives you the overall picture and prevents misunderstandings.
2️⃣ Identify the main features
Focus on the most important details: overall trends, the highest and lowest values, sharp rises or falls, similarities or contrasts and any turning points. Avoid minor fluctuations.
3️⃣ Group the information
Organise the data so your description flows logically. You can group by trend direction (increases vs decreases), by time period (early vs later years) or by similarity/contrast between categories. This helps you write coherent paragraphs rather than listing numbers.
4️⃣ Plan your structure
A clear structure usually includes four parts:
- Introduction (what the visual shows).
- Overview (the key trends).
- Details paragraph 1 (first group of information).
- Details paragraph 2 (second group).
This approach keeps your writing focused and easy to follow.
5️⃣ Select key data
Choose only the most relevant figures to illustrate the patterns you describe. One or two numbers per paragraph are usually enough. Avoid including every data point.
Paragraph structure
Once you have planned your ideas, organise them into clear paragraphs. A clear description of visual data normally has four parts: an introduction, an overview and two paragraphs with detailed information. The introduction states what the visual shows, the overview highlights the main trends and the detail paragraphs describe the data in a logical order.
1. Introduction
The introduction tells the reader what the visual represents:
It usually includes:
- the topic
- the categories
- the time period
The graph shows the average number of commuters travelling by car, bus or train in the UK between 1970 and 2030.
2. Overview
This paragraph highlights the most significant changes or patterns without specific data.
Overall, car use increased, bus use declined and train travel, although it fluctuated slightly after 2000, showed an overall upward trend.
3. Details paragraph 1
The first detail paragraph presents the main group of information, usually the categories that follow similar trends or show the most significant changes.
Car use rose slightly in the early years and then increased steadily to around 7 million by 2000. After a short period of stability in the first decade of the twenty-first century, it climbed sharply and is expected to reach almost 9 million by 2030. Meanwhile, train travel grew gradually until 2000, showed a slight decrease between 2000 and 2010 and then rose more significantly, overtaking bus use towards the end of the period. Between 2010 and 2030, both car and train travel show the sharpest rise in the period, each increasing by around 2 million users, with the largest single increase seen in car use from 2020 to 2030, when it rises by approximately 1.5 million.
4. Details paragraph 2
The second detail paragraph describes the remaining data, often contrasting with the trends in the previous paragraph.
In contrast, bus travel declined slightly in the early years, falling from around 4 million to just under 4 million users. It then continued to fall steadily throughout the rest of the period, dropping to just over 3 million by 2010. Although bus use remained higher than train travel for most of the timeframe, the gap between them narrowed considerably after 2000 as train numbers increased more rapidly. By 2030, bus travel is projected to drop to just under 3 million, making it the least-used of the three modes of transport.
Useful language for describing visual data
Use the expressions below to describe increases, decreases, stability, fluctuations and comparisons in charts and graphs. These verbs and phrases will help you write clear and accurate descriptions at C1 level.
Verbs for describing what the chart shows
- show: The chart shows the global electricity mix in 2000 and 2020.
- illustrate: The two pie charts illustrate how energy sources changed over time.
- indicate: The data indicates a clear rise in renewables.
- represent: Renewables represent 13% of the mix in 2020.
- account for: Fossil fuels account for more than 60% in both years.
- make up: Nuclear makes up 9% of electricity generation in 2020.
- undergo: Renewables underwent a significant increase over the period.
- experience: Nuclear experienced a sharp decline from 2000 to 2020.
Verbs describing increases
- rise: Car use rose in the early years.
- increase: The number of commuters increased after 1990.
- grow: Train travel grew steadily throughout the late period.
- climb: Car use climbed sharply towards 2030.
Verbs describing decreases
- fall: Bus use fell during the first decade.
- decline: Passenger numbers declined after 2000.
- drop: The figure dropped to just over 3 million.
- decrease: Bus travel decreased gradually from 1970.
Adverbs of change
Use these adverbs with increase/decrease verbs to show how fast or how noticeably something changed.
- slightly: Train travel increased slightly in the early years.
- steadily: Car use grew steadily until 2000.
- gradually: Bus numbers decreased gradually over the period.
- significantly: Train use rose significantly after 2010.
- sharply: Car commuting climbed sharply towards 2030.
- considerably: Bus travel dropped considerably after 2000.
- slowly: The figure increased slowly at first.
- rapidly: Train use grew rapidly in the final decade.
Adjective + noun phrases
Use adjective + noun phrases alongside verb + adverb structures, and alternate between them to make your writing more varied, formal and natural at C1 level.
- a slight increase: There was a slight increase in train use after 1990.
- a steady rise: The graph shows a steady rise in car commuting during the early years.
- a gradual decrease: Bus travel experienced a gradual decrease throughout the period.
- a sharp fall: There was a sharp fall in bus numbers after 2000.
- a significant rise: Train use saw a significant rise between 2010 and 2030.
- a considerable drop: The data shows a considerable drop in bus travel in the early 2000s.
- a slight dip: Train travel experienced a slight dip between 2000 and 2010.
- a period of stability: Car use went through a period of stability before rising again.
- the highest figure: Car travel reached the highest figure towards the end of the period.
- the lowest point: Bus use fell to its lowest point by 2030.
- a small fraction: In 2000, renewables represented only a small fraction of the total.
Describing changes in position
- overtake: English overtook Mandarin to become the most widely spoken language.
- remain ahead of: Mandarin remained ahead of Spanish throughout the period.
- fall behind: French fell behind Arabic after 2000.
- move into first/second place: English moved into first place by 2025.
Describing fluctuations
- fluctuate: Train travel fluctuated slightly after 2000.
- vary: The numbers varied during the mid-period.
- dip: Train use dipped briefly before rising again.
Describing stability
- remain stable: The figure remained stable for about ten years.
- stay the same: Bus numbers stayed the same during the late 1990s.
- level off: Car use levelled off briefly after 2000.
Making comparisons
At C1 level, you can make your comparisons more precise and formal by using modifiers with comparative adjectives and quantitative expressions.
- slightly higher than: Car use was slightly higher than train use in the early years.
- significantly higher than: Train use became significantly higher than bus travel after 2010.
- marginally lower than: Bus numbers were marginally lower than train numbers by the end of the period.
- considerably lower than: Bus use was considerably lower than car use throughout the period.
- substantially more … than: Substantially more commuters travelled by car than by bus.
- slightly fewer … than: Slightly fewer people used the bus in 2000 than in 1990.
- far more … than: Far more commuters chose cars than any other mode of transport.
- almost as many … as: By 2030, almost as many people travelled by train as by car.
Describing proportions and quantities
- just under: Bus use fell to just under 3 million.
- just over: Train use rose to just over 4 million.
- approximately: Approximately 5 million commuters travelled by train in 2030.
- around: Car use reached around 7 million in 2000.
- nearly: Bus travel dropped to nearly 3 million in the final decade.
Describing predictions
- is expected to: Car use is expected to reach 9 million by 2030.
- is projected to: Bus travel is projected to fall further in the final decade.
- is likely to: Train use is likely to increase steadily.
Describing the biggest changes
- the sharpest rise: The sharpest rise occurred in car use after 2020.
- the most significant increase: Train travel showed the most significant increase after 2010.
- the largest single change: Car use recorded the largest single change from 2020 to 2030.
Linking expressions
- meanwhile: Meanwhile, train travel continued to grow.
- in contrast: In contrast, bus use fell steadily.
- however: Car use increased; however, bus numbers declined.
- towards the end of the period: Train use rose towards the end of the period.
- in the early years: Bus travel declined in the early years.
Ready to practice?
Put your knowledge to the test with interactive exercises (3 exercises available).
Download Lesson & Exercises as PDF
Get printable PDF worksheets for Describing visual data – C1 English Writing including grammar explanations, exercises, and answer keys.